Understanding WorkComposer Reports
Comprehensive Analytics for Your Team
WorkComposer's advanced reporting suite provides deep insights into how your team works, helping you make data-driven decisions to boost productivity and streamline operations. Each report offers a unique perspective on team performance, from real-time activity monitoring to long-term productivity trends.
Whether you need to track attendance patterns, understand application usage, monitor project progress, or verify remote work locations, WorkComposer's reports deliver the actionable intelligence you need. All reports can be filtered by user, team, date range, and timezone, then exported to Excel or CSV for further analysis.
Click on any screenshot below to view it in full size and explore the detailed information each report provides.
Overview Report
Your central dashboard for team productivity
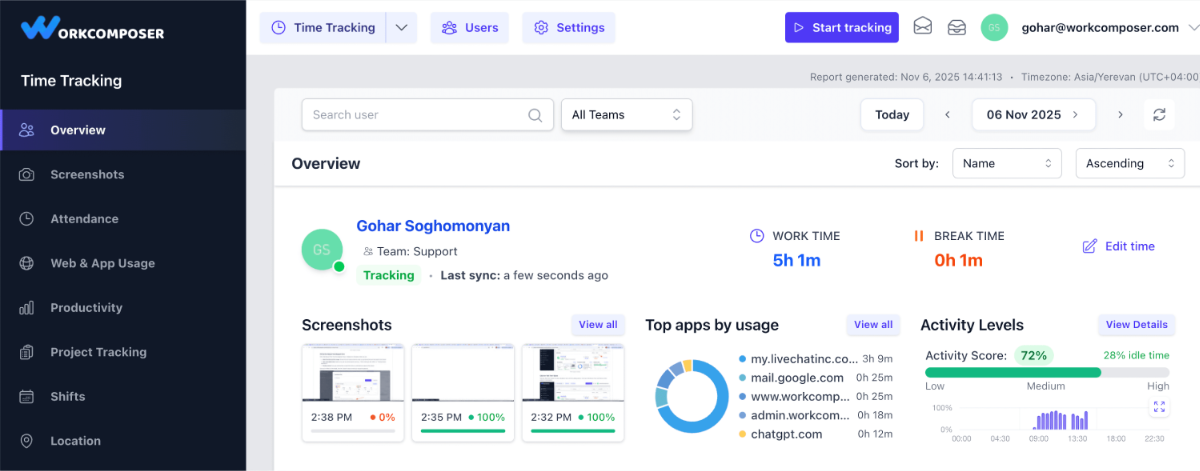
The Overview Report is your starting point for understanding how each team member spends their workday. It brings together the latest screenshots, app and website activity, keyboard and mouse usage, and idle time in a single, unified view. This comprehensive dashboard helps managers get an instant snapshot of user productivity without digging through separate tabs or multiple reports.
Each user's data can be filtered by date and timezone, offering clarity across distributed teams regardless of where they're located. The report updates in real-time, ensuring you always have access to the most current information about your team's activities.
Use this report to quickly identify who's actively working, spot potential blockers, and get a high-level understanding of daily workflows. It's particularly valuable for daily stand-ups, quick check-ins, and maintaining awareness of team dynamics across different time zones.
Click image to enlarge
Screenshots Report
Visual verification of work activities
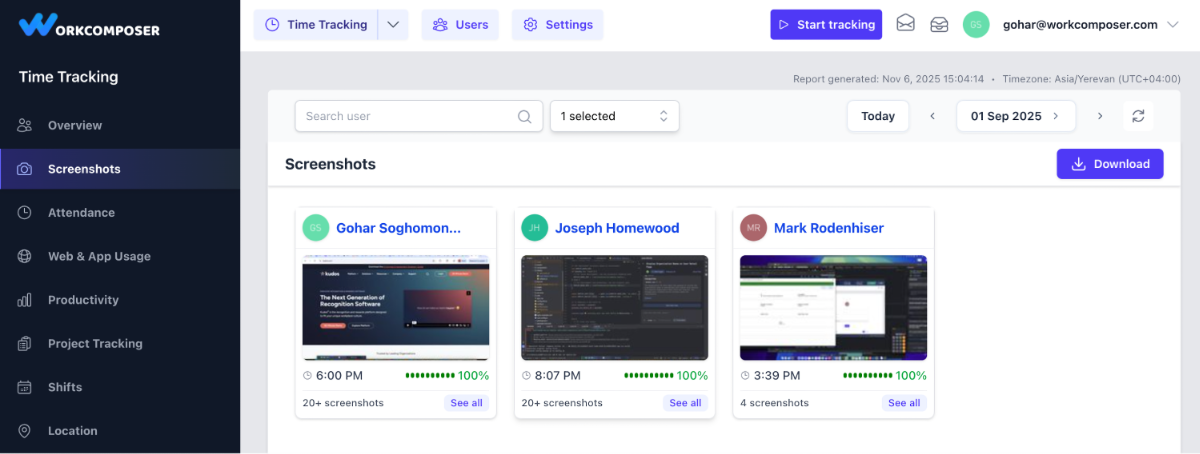
The Screenshots Report offers a visual record of what your team is working on throughout the day. WorkComposer automatically captures screenshots at regular intervals—typically every five minutes—though this frequency can be adjusted in your account settings to match your team's needs and privacy preferences.
Each screenshot displays not only the screen content but also metadata including the applications and websites in use at that moment, the active project or task, and precise timestamps. You can expand any screenshot for a closer, full-screen view, giving managers complete context without disrupting workflows or requiring explanations from team members.
To support privacy needs and comply with data protection requirements, screenshots can be blurred automatically, and the capture timing can be randomized to reduce predictability. While users cannot delete their own screenshots (ensuring accountability), administrators have the ability to remove time entries and associated screenshots if necessary for privacy or compliance reasons.
Click image to enlarge
Attendance Report
Track work hours and availability patterns
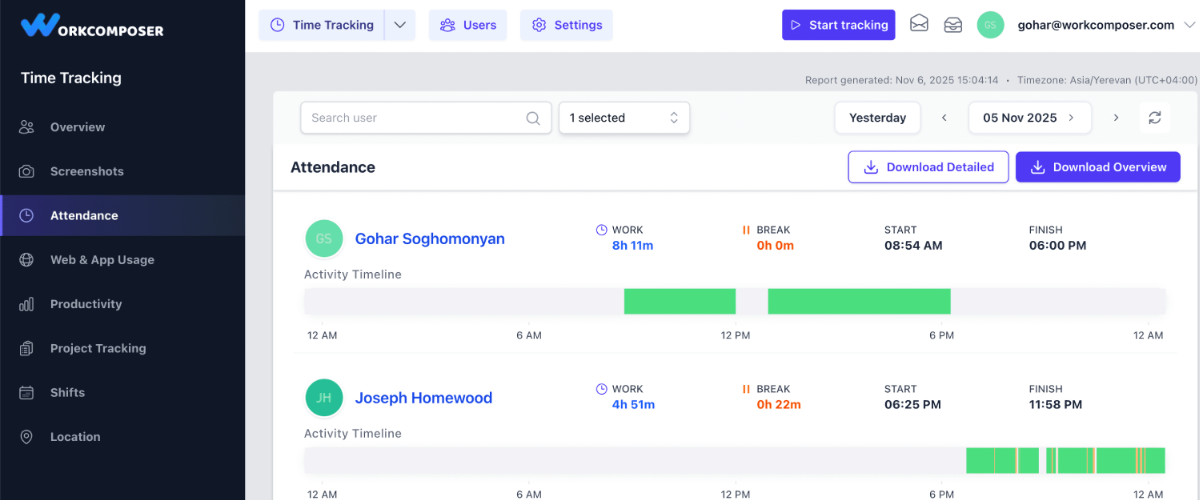
The Attendance Report tracks when users start and end their workday, making it simple to understand overall availability and work patterns across your team. It automatically records log-in times, break periods, and any offline gaps, displaying them on an intuitive, color-coded timeline that quickly shows who was actively working, who took breaks, and when users were inactive.
The visual timeline uses a clear color scheme: green indicates active work time, yellow represents break periods, and white shows offline or inactive periods. This color-coding makes it easy to spot patterns at a glance, identify attendance issues, and understand work-life balance across your team.
This report eliminates the need for manual timesheets and provides team leaders and HR managers with an instant, accurate view of daily attendance patterns. It's invaluable for payroll processing, compliance reporting, and identifying trends that might indicate burnout or disengagement. You can quickly generate summaries for any date range, making it perfect for weekly reviews or monthly reports.
Click image to enlarge
Web & App Usage Report
Understand how work time is allocated
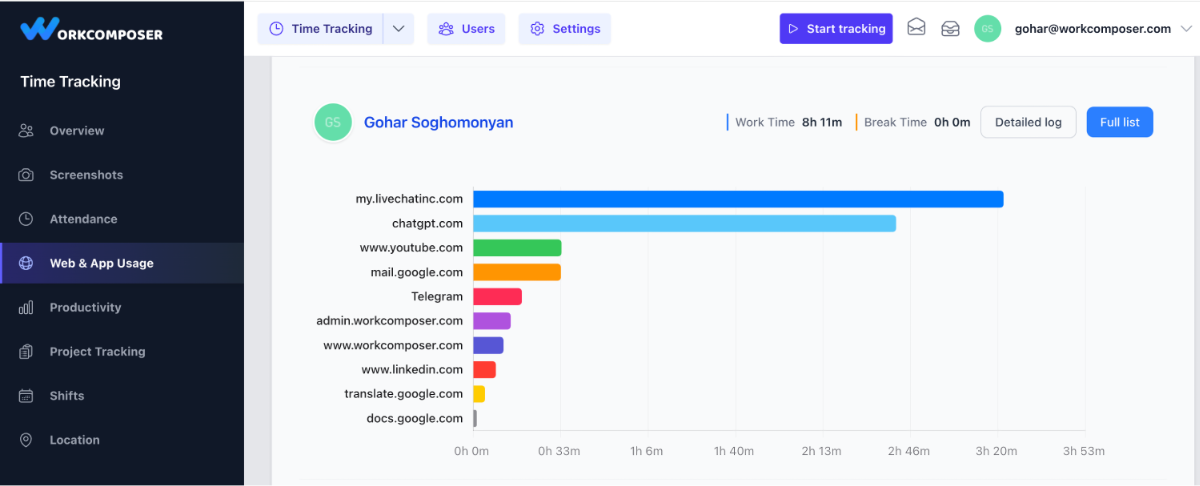
The Web & App Usage Report shows exactly how work time is spent by tracking which applications and websites each user interacts with during their working hours. This granular visibility provides a detailed breakdown of usage durations, helping you distinguish between productive tools and potential distractions.
Managers can view specific application names, complete URLs (not just domain names), and the precise time spent on each platform. The detailed log feature allows you to drill down into individual sessions, making it easy to spot unusual patterns, verify that the right tools are being used for specific tasks, or identify opportunities for workflow optimization.
This report is particularly valuable for understanding software license utilization, identifying training needs, and ensuring compliance with company IT policies. For example, you might discover that expensive software licenses are underutilized, or that team members are using unapproved tools that could pose security risks. Learn more about website usage tracking features.
Click image to enlarge
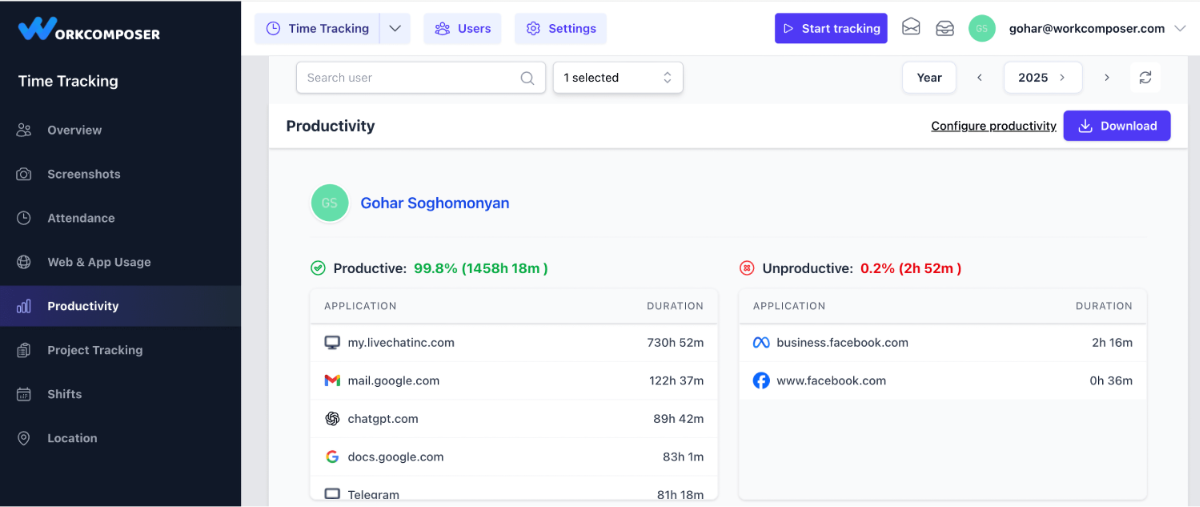
Productivity Report
Measure effectiveness and focus levels
The Productivity Report helps you assess how effectively your team uses their time by categorizing the applications and websites they access throughout the day. WorkComposer allows you to specify which apps and sites are considered productive, unproductive, or blacklisted, with the flexibility to set these rules differently for each department, team, or individual role.
This customization is crucial because productivity isn't one-size-fits-all. For example, a marketing team might legitimately use social media platforms as part of their daily workflow for campaign management and audience engagement, while the same platforms could be distractions for your development or accounting teams. Once you've configured these productivity categories, WorkComposer automatically classifies time spent in each application or website accordingly.
The report visualizes this data through clear charts and percentages, showing the ratio of productive to unproductive time, and highlighting any use of blacklisted resources. This information helps managers identify potential distractions, provide targeted coaching, and recognize top performers. It also ensures the data aligns perfectly with your company's expectations and industry-specific workflows. Configure your productive and unproductive apps list to get started.
Click image to enlarge
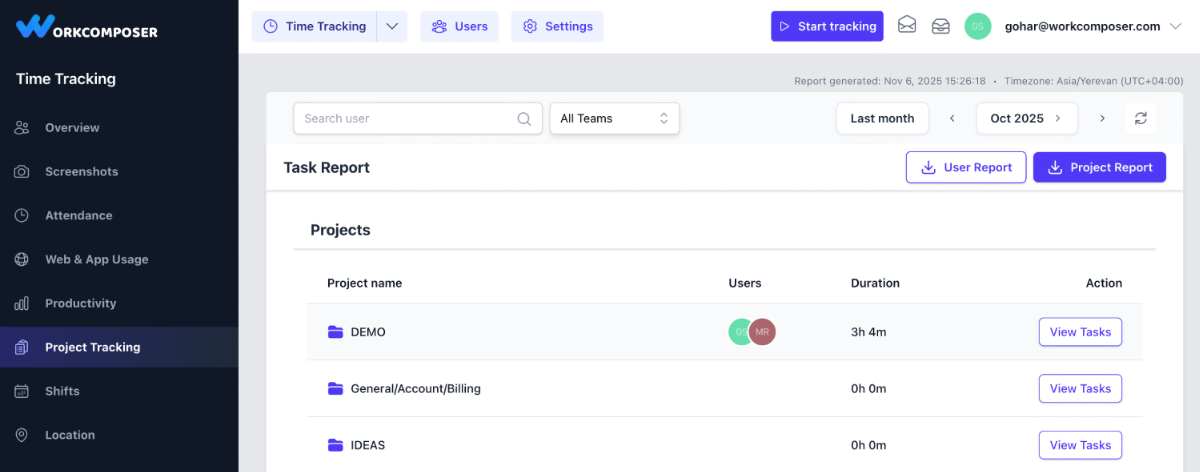
Project Tracking Report
Monitor project progress and resource allocation
The Project Tracking Report gives you a clear, comprehensive picture of how time is distributed across different projects and tasks within your team. It shows which users worked on which tasks, how long they spent on each assignment, and how effort is divided across multiple projects over any specified time period.
Once projects and tasks are created and assigned to team members, employees simply select their current task from the desktop app's dropdown menu before they begin working. WorkComposer then automatically tracks all time spent on that task, along with associated screenshots and activity data. This seamless integration means no manual time entry is required, reducing administrative overhead and improving accuracy.
This report allows managers to review project progress without constant check-ins or status meetings, understand where team time is actually being invested (versus planned), and make more informed decisions about workloads, resource allocation, and project deadlines. It's especially valuable for client billing, project budgeting, capacity planning, and identifying tasks that consistently take longer than expected. You can also identify top contributors to each project and spot potential bottlenecks before they impact delivery timelines.
Click image to enlarge
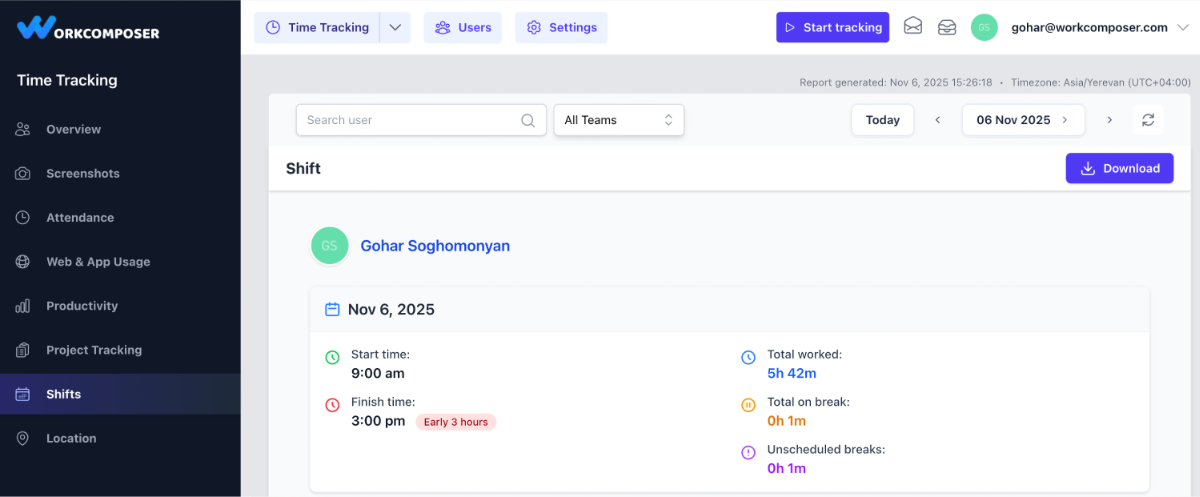
Shift Report
Verify schedule adherence and shift compliance
The Shift Report helps you monitor whether employees are working within their assigned schedules, making it invaluable for organizations with structured shifts or specific working hours. Once shift times are configured in your WorkComposer settings, this report automatically compares actual work time against scheduled shifts, showing who arrived late, left early, or stayed on track.
The report breaks down time worked during scheduled hours versus time worked outside of assigned shifts, providing clear visibility into attendance habits and schedule adherence. It highlights early arrivals, late starts, overtime hours, and any work performed outside of regular shift windows. This granular data helps identify patterns that might require attention, such as consistent tardiness or excessive overtime that could indicate workload imbalances.
Whether you're managing in-office teams with fixed schedules, remote staff across different time zones, or a hybrid workforce with flexible arrangements, the Shift Report provides clear visibility into attendance habits without the need for manual oversight or punch clocks. It's particularly useful for payroll processing, compliance with labor regulations, shift differential calculations, and fair scheduling practices. The report can help you optimize shift coverage and ensure adequate staffing during peak business hours.
Click image to enlarge
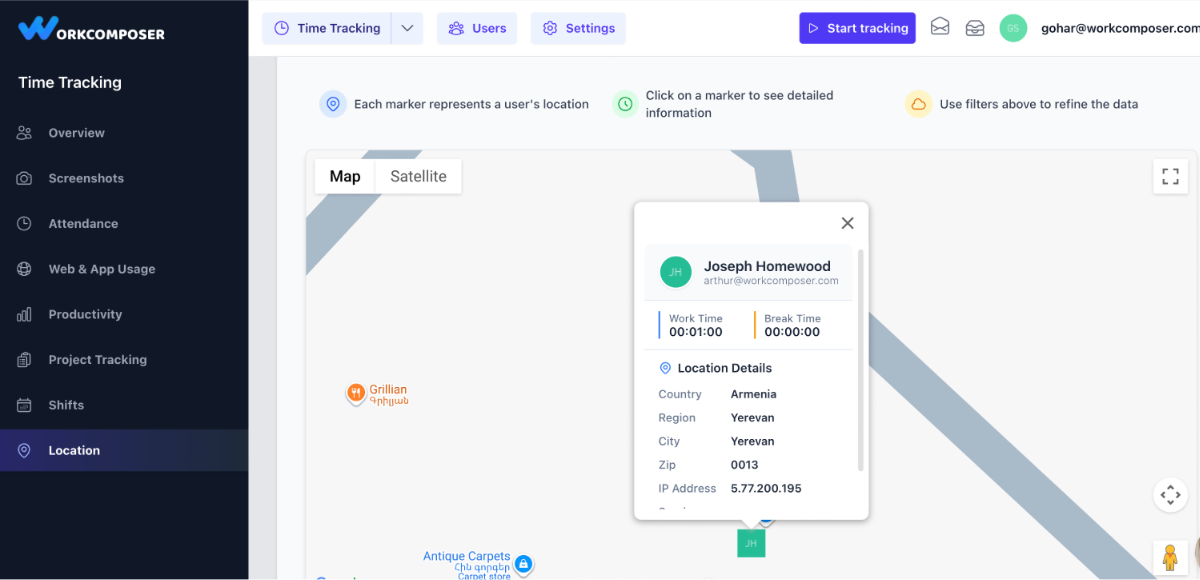
Location Report
Verify work locations and ensure security
The Location Report gives you insight into where your team is working from by detecting the approximate location of each user based on their IP address. While it doesn't use GPS tracking or mobile device location services, it still provides valuable city-level or ZIP-code accuracy, along with the associated internet service provider (ISP) and detailed IP information.
This report is especially helpful for verifying remote work policies and ensuring employees are working from approved locations. For example, you can confirm whether team members are working from their home offices as expected, or identify if someone is consistently logging in from an unexpected region. It's also valuable for security purposes, helping you detect unauthorized access attempts or account compromises by spotting logins from unusual or suspicious locations.
The Location Report can help you ensure compliance with data protection regulations that restrict where certain work can be performed, verify that sensitive information isn't being accessed from prohibited countries or regions, and optimize your team structure by understanding the geographic distribution of your workforce. For organizations with location-based pay differentials or tax considerations, this report provides the documentation needed for accurate record-keeping and compliance reporting.
Click image to enlarge
Quick Reference: Report Capabilities
Common Features
- •Filter by user, team, or date range
- •Export to Excel or CSV format
- •Timezone-aware reporting
- •Real-time data updates
- •Historical data access
Best Practices
- •Review reports regularly for patterns
- •Configure productivity categories per team
- •Use multiple reports for complete insights
- •Set up automated report schedules
- •Communicate reporting policies clearly